<?xml version="1.0" encoding="utf-8"?><feed xmlns="http://www.w3.org/2005/Atom" ><generator uri="https://jekyllrb.com/" version="3.10.0">Jekyll</generator><link href="https://jorpppp.github.io/feed.xml" rel="self" type="application/atom+xml" /><link href="https://jorpppp.github.io/" rel="alternate" type="text/html" /><updated>2026-03-01T22:04:06-05:00</updated><id>https://jorpppp.github.io/feed.xml</id><title type="html">Jorge Pérez Pérez</title><subtitle>Research website</subtitle><author><name>Jorge Pérez Pérez</name><email>jorgepp@banxico.org.mx</email></author><entry><title type="html">Workers, Workplaces, Sorting and Wage Dispersion in Mexico</title><link href="https://jorpppp.github.io/posts/2024/08/akmmexico/" rel="alternate" type="text/html" title="Workers, Workplaces, Sorting and Wage Dispersion in Mexico" /><published>2024-08-12T00:00:00-04:00</published><updated>2024-08-12T00:00:00-04:00</updated><id>https://jorpppp.github.io/posts/2024/08/akmmexico</id><content type="html" xml:base="https://jorpppp.github.io/posts/2024/08/akmmexico/"><![CDATA[<p><a href="https://www.banxico.org.mx/publicaciones-y-prensa/documentos-de-investigacion-del-banco-de-mexico/resumenes-ejecutivos/%7B76AF8A12-2C8B-5A8B-DC4A-B5C46ED1EA4C%7D.pdf">Versión en español</a></p>

<p>In most countries, wage dispersion has recently increased, drawing researchers’ and policymakers’ attention. The dispersion in wages can be due to various reasons. For instance, it may come from differences in worker characteristics such as education or skills. However, even if people have the same characteristics, their wages can vary depending on the company they work for. More productive companies may pay higher wages, and these differences in productivity also contribute to wage dispersion. It could even be the case that workers with characteristics associated with high salaries tend to be employed by companies that pay high wages, a phenomenon known as positive assortative matching.</p>

<p>In a recent <a href="https://www.banxico.org.mx/DIBM/web/documento/visor.html?clave=2024-06&amp;locale=en">article</a> with <a href="https://jgnunol.github.io/">José Nuño-Ledesma</a>, forthcoming in <a href="https://economia.lse.ac.uk/">Economia</a>, we study wage dispersion in Mexico, breaking it down into components associated with the reasons described: individual characteristics, company characteristics, and selective matching at both the national and regional levels.</p>

<h2 id="methodology">Methodology</h2>

<p>We model the wages of person $i$ in month $t$ using a linear regression with bidirectional fixed effects:</p>

\[\ln(wage_{it}) = \alpha_i + \psi_{J(it)} + X'_{it} \beta + r_{it}\]

<p>The worker fixed effects $\alpha_i$ remain constant over time and capture individual characteristics that receive the same compensation across companies, such as skills or education. The workplace effects $\psi_{J(it)}$ capture the wage premium for all workers employed at the same workplace $J$. The vector $X_{it}$ contains observable characteristics of the individuals, and the term $r_{it}$ represents a residual. We estimate the model using social security data from the Mexican Social Security Institute (IMSS) for 2004 to 2018 in five-year intervals.</p>

<p>With this model, we decompose the variance of wages as follows:</p>

\[\operatorname{Var}\left(\ln \text{wage}_{it}\right)= \underbrace{\operatorname{Var}(\alpha_{i})}_{\text {workers }} + \underbrace{\operatorname{Var}(\psi_{\textbf{J}(it)})}_{\text {workplaces }} + 2 \underbrace{\operatorname{Cov}(\alpha_{i}, \psi_{\textbf{J}(it)})}_{\text {sorting}}) + remainder.\]

<p>Hence, a part of the wage variance is due to wage dispersion resulting from differences in worker characteristics, another part to dispersion in company wage premiums, and a third part to the extent to which the matching between workers and companies affects wages. When the covariance between company and worker effects is positive, high-wage workers (with a high $\alpha_i$ value) work at companies that pay high wages (with a high $\psi_J$ value)</p>

<h2 id="results">Results</h2>

<p>On the left panel of Figure 1, we show the results of the wage variance decomposition for men aged 25 to 54. The contribution of the individual components decreases over time, from 44% in 2004-2008 to 37% in 2014-2018. In contrast, the importance of the company components and selective matching has increased over time. When comparing 2014-2018 with 2004-2008, company effects account for about four percentage points more of the wage variance, and the covariance associated with selective matching accounts for about three percentage points more.</p>

<p>On the right panel, we show analogous variance decomposition results for wages in other countries. The contribution of company-level factors to wage dispersion in Mexico is higher than in the United States, Germany, and Brazil.
​</p>
<h3 id="figure-1-wage-variance-decomposition">Figure 1. Wage Variance Decomposition</h3>

<p><img src="/images/blog/2024/08/fig1.png" alt="Figure 1: Wage Variance Decomposition" width="700" /></p>

<p>
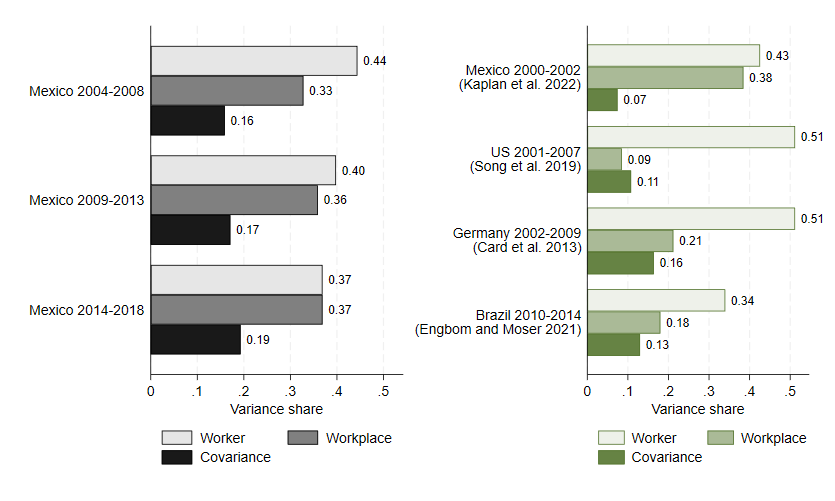
Figure 2 shows how the worker, firm, and covariance components contribute to wage dispersion across the country’s four regions. The contributions of each element to wage dispersion in the regions follow the same trend over time as the contributions at the national level.</p>

<h3 id="figure-2-estimated-contributions-to-variance-by-region-and-their-change-over-time">Figure 2. Estimated Contributions to Variance by Region and their Change over Time</h3>

<p><img src="/images/blog/2024/08/fig2.png" alt="Figure 2: Estimated Contributions to Variance by Region and their Change over Time" width="700" /></p>

<p>
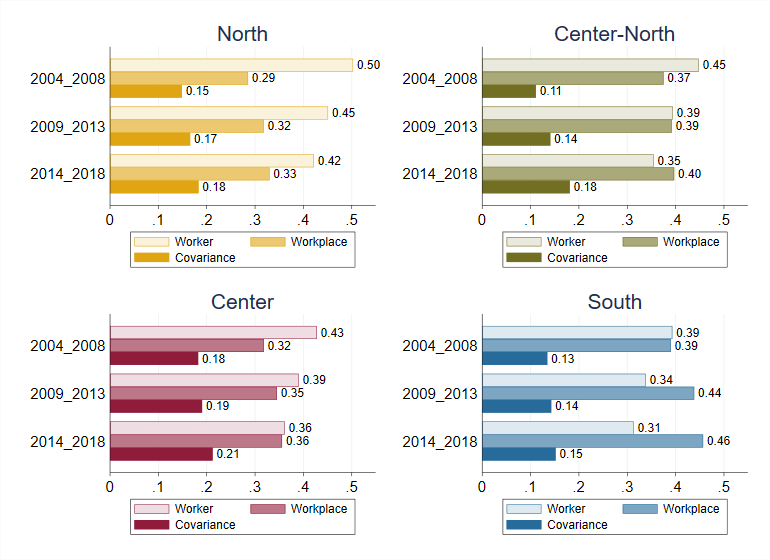
The contribution of firm effects to wage variance correlates negatively with regional GDP per capita. Firm effects are relatively more important in determining wage variance in the South, followed by the center-north, the central region, and finally, the North region. The article shows that this pattern is also present among states.</p>

<p>Assortative matching has a higher contribution to wage dispersion in the northern and central regions of the country. Our analysis shows that within each region, the contribution of selective matching to wage dispersion is greater in larger companies.</p>

<p>The tools for analyzing wage dispersion in Mexico presented in this paper are a starting point for future research on wages in the country. It will be interesting to examine how recent labor market reforms and changes associated with the pandemic have affected the contribution of wage dispersion determinants.</p>]]></content><author><name>Jorge Pérez Pérez</name><email>jorgepp@banxico.org.mx</email></author><category term="assortative matching" /><category term="regional development" /><category term="wage dispersion" /><category term="workplace wage premia" /><category term="research" /><summary type="html"><![CDATA[Between 2004 and 2018, the spread of wages in Mexico's private labor sector remained stable. Nonetheless, the underlying factors behind salary dispersion underwent significant shifts. To uncover these changes, we analyze an employer-employee dataset comprising the near-universe of Mexico's formal employment. We estimate log wage models and decompose earnings dispersions into worker, workplace and sorting components. At the national level, we find that sorting increased its importance over time. While worker-level factors were the main contributors to salary variability in the 2004-2008 period, workplace factors became as important as worker-level factors in the 2014-2018 time segment. The influence of workplace factors on wage dispersion correlates negatively with per capita GDP at the regional level.]]></summary></entry><entry><title type="html">Disentangling the Effects of Large Minimum Wage and VAT Changes on Prices: Evidence from Mexico</title><link href="https://jorpppp.github.io/posts/2022/11/mwmexico/" rel="alternate" type="text/html" title="Disentangling the Effects of Large Minimum Wage and VAT Changes on Prices: Evidence from Mexico" /><published>2022-11-21T00:00:00-05:00</published><updated>2022-11-21T00:00:00-05:00</updated><id>https://jorpppp.github.io/posts/2022/11/mwmexico</id><content type="html" xml:base="https://jorpppp.github.io/posts/2022/11/mwmexico/"><![CDATA[<p><a href="https://www.banxico.org.mx/publicaciones-y-prensa/documentos-de-investigacion-del-banco-de-mexico/resumenes-ejecutivos/%7B11594F29-2448-1B55-266B-A487905391E9%7D.pdf">Versión en español</a></p>

<p>In January 2019, Mexican authorities increased the minimum wage by 100% in Mexico’s Northern Border Free Zone (ZLFN, by its spanish acronym, Zona Libre de la Frontera Norte), and at the same time, they reduced the VAT tax rate from 16% to 8%. In the rest of the country, the minimum wage increased 16.21% and the VAT rate did not change. In a recent <a href="https://doi.org/10.1016/j.labeco.2022.102294">article</a> with Mariana Calderón, Josué Cortés and Alejandrina Salcedo, we study the effects of these substantial policy changes on prices.</p>

<p>The mexican context is important because of the magnitude of these minimum wage and VAT changes, since they may induce large price adjustments. Moreover, the simultaneous implementation of both policies is interesting in itself, as their effects may cancel out. The policy combination of a greater minimum wage and a reduced VAT rate may be specific to the mexican context. Nevertheless, the challenge of separating the effects of policies that are implementes simultaneously is frequent in policy evaluation. It is essential to be able to disentangle the effects to be able to rigurously evaluate the policies. In this case, we identify the effects of both policies separately using geographical differences in the policies and industry variation in their incidence.</p>

<h2 id="research-strategy">Research Strategy</h2>

<p>First, to estimate the effects of the minimum wage increase on the prices of VAT goods, we take advantage of variation in minimum wage incidence across industries in the ZLFN, and we compare the evolution of prices between industries. We measure incidence as the fraction of workers for whom the minimum wage increase is binding in each industry. These workers are those who earned less than the 2019 minimum wage in the ZLFN (176.72 pesos) in December 2018, and therefore should receive a wage increase in January 2019.</p>

<p>Second, to identify the effect of the minimum wage increase on the price of goods not subject to the VAT tax, we compare the prices of these goods between the ZLFN and the rest of Mexico’s northern region, taking advantage of the differential increase in the minimum wage across places.</p>

<p>Last, to estimate the effect of the VAT rate reduction, first, we compare the prices of VAT goods in the ZLFN with the rest of the northern region. This comparison yields a combined minimum wage increase plus VAT rate reduction effect. Then, we subtract the minimum wage effect from this combined effect, obtaining a VAT effect.</p>

<p>We estimate the minimum wage and VAT effects on both VAT and Non-VAT goods’ prices using a triple differences econometric model. To do this, we use administrative data from the Mexican Social Security Institute, and product level price information from the National Consumer Price Index.</p>

<h2 id="results">Results</h2>

<p>Figures 1 to 3 shows dynamic estimates of the effect of the policies on prices. Figure 1 shows the estimated effect of the minimum wage increase on the prices of VAT goods. The coefficient measures the effect of each percentage point of workers bound to the minimum wage increase on prices. Comparing the coefficients before and after the minimum wage increase, the coefficient is 0.00084. The average fraction of workers affected is 30.53%. Multiplying the effect and the average fraction affected yields an average price increase of 2.56%.</p>

<h3 id="figure-1-effect-of-a-larger-fraction-of-workers-affected-by-the-minimum-wage-on-vat-goods">Figure 1. Effect of a larger fraction of workers affected by the minimum wage on VAT goods</h3>

<object data="/images/blog/2022/11/ES_PBISH_gral_shzlfn5_nc.pdf" type="application/pdf" width="700px" height="500px">	
    <embed src="/images/blog/2022/11/ES_PBISH_gral_shzlfn5_nc.pdf" />
        <p>This browser does not support PDFs. Please download the PDF to view it: <a href="http://yoursite.com/the.pdf">Download PDF</a>.</p>
    &lt;/embed&gt;
	
</object>

<p>Figure 2 shows estimates of the effects of the minimum wage increase on the prices of Non-VAT goods. This effect is small and not statistically significant, standing in contrast to the effect on VAT goods.</p>

<h3 id="figure-2-effect-of-the-minimum-wage-on-the-price-of-non-vat-goods">Figure 2. Effect of the minimum wage on the price of Non-VAT goods</h3>

<object data="/images/blog/2022/11/ES_PBSM_gral_shzlfn5_nc.pdf" type="application/pdf" width="700px" height="500px">	
    <embed src="/images/blog/2022/11/ES_PBSM_gral_shzlfn5_nc.pdf" />
        <p>This browser does not support PDFs. Please download the PDF to view it: <a href="http://yoursite.com/the.pdf">Download PDF</a>.</p>
    &lt;/embed&gt;
	
</object>

<p>The differences in the fraction of informal labor used to produce each good seem to play a role on the impact of the minimum wage on prices. Non-VAT goods tend to be produced with more informal labor, relative to VAT goods. This difference may explain the smaller effect of the minimum wage on Non-VAT goods prices. Even among VAT goods, those with a larger fraction of informal labor in production show smaller price increases associated with the minimum wage hike.</p>

<p>Figure 3 shows estimates of the effect of the VAT rate reduction on VAT goods’ prices. The estimated effect is a price reduction of about 4%.</p>

<h3 id="figure-3-effect-of-the-vat-on-the-price-of-vat-goods">Figure 3. Effect of the VAT on the price of VAT goods</h3>

<object data="/images/blog/2022/11/ES_PBIVA_gral_shzlfn5_nc.pdf" type="application/pdf" width="700px" height="500px">	
    <embed src="/images/blog/2022/11/ES_PBIVA_gral_shzlfn5_nc.pdf" />
        <p>This browser does not support PDFs. Please download the PDF to view it: <a href="http://yoursite.com/the.pdf">Download PDF</a>.</p>
    &lt;/embed&gt;	
</object>

<p>Weighting these effects by their contribution to the ZLFN’s consumer price index, we find that the VAT rate reduction offset the price increase due to the higher minimum wage. The minimum wage increase led to an estimated 1.2% increase in the ZLFN’s consumer price index. The VAT rate reduction led to an estimated 2.57% reduction in prices. Combining both effects, the net effect was a 1.37% decrease in the ZLFN’s price index. Since the policy combinaton led to a price reduction, it increased workers’ real wages.</p>]]></content><author><name>Jorge Pérez Pérez</name><email>jorgepp@banxico.org.mx</email></author><category term="minimum wage" /><category term="value-added tax" /><category term="prices" /><category term="research" /><summary type="html"><![CDATA[In January 2019, in an effort to boost activity on the northern Mexican border, the authorities increased the minimum wage by 100 percent and decreased the value-added tax (VAT) by half. Disentangling both effects, we find increments in prices due to the minimum wage hike that were more than offset by the decreases associated with the VAT. In the absence of both policy changes, average prices would have been higher. The share of informal labor in the production of different goods seems to be playing a role in the impact of the minimum wage on prices.]]></summary></entry><entry><title type="html">Carta a Honorable Representate Arcos Benavides respecto a Ley del Economista</title><link href="https://jorpppp.github.io/posts/2021/8/le/" rel="alternate" type="text/html" title="Carta a Honorable Representate Arcos Benavides respecto a Ley del Economista" /><published>2021-08-26T00:00:00-04:00</published><updated>2021-08-26T00:00:00-04:00</updated><id>https://jorpppp.github.io/posts/2021/8/ne</id><content type="html" xml:base="https://jorpppp.github.io/posts/2021/8/le/"><![CDATA[<p>Ciudad de México, 26 de Agosto de 2018</p>

<p>Estimado H.R. Arcos Benavides.</p>

<p>Mi nombre es Jorge Eduardo Pérez Pérez. Soy Colombiano, economista de la Universidad del Rosario, y Magister y Ph.D. en Economía de Brown University. Actualmente me desempeño como
 investigador económico en el Banco de México, la autoridad monetaria de México.</p>

<p>Escribo para manifestar mi preocupación acerca del proyecto de Ley 216/2021C “Ley del Economista” actualmente en trámite en la cámara de representantes, y de su autoría. Mi
 preocupación no es únicamente mía, sino de múltiples economistas colombianos. A nuestro juicio, la ley incluye varios incisos sumamente inconvenientes y no va a ayudar a ejercer
 la profesión de economista. Por el contrario, las propuestas de la ley limitarían seriamente la enseñanza y práctica de la economía. A continuación enumero algunas de las
 preocupaciones:</p>

<ol>
  <li>
    <p>El proyecto de ley pretende prohibir la crítica profesional entre economistas. El debate académico en economía es una parte fundamental de la profesión, y limitar el debate entre 
colegas, incluso cuando este resulte perjudicial para las partes, es limitante, además de ser un ataque a la libre expresión. En un seminario académico de economía, y en la discusión
 de políticas públicas el debate es esencial. Consideramos inconveniente cualquier intento a limitar este debate.</p>
  </li>
  <li>
    <p>El proyecto de ley limita la enseñanza de economía por personas sin un título profesional de economía, y pretende limitar el currículo de economía. Este intento de regulación
 es inconveniente pues muchos de los académicos de economía no tienen un título académico en economía, sino en ciencias afines. Por otro lado, el currículo de economía debería
 ser de libre elección de académicos e instituciones educativas.</p>
  </li>
  <li>
    <p>El proyecto pretende ampliar las funciones y capacidades del Consejo Nacional de Profesionales de Economía. Es inconveniente capacidad a este organismo para limitar el ejercicio
 de la profesión, y respetuosamente considero que dicho organismo no está llevando a cabo funciones útiles para el gremio, más allá de un cobro excesivo por un licenciamiento
 profesional innecesario.</p>
  </li>
</ol>

<p>Espero que este correo lo lleve a reconsiderar su posición en torno a este proyecto de ley y su conveniencia. Estoy disponible para proveer cualquier información adicional que pueda contribuir al debate sobre este proyecto.</p>

<p>Cordialmente,</p>

<p>Jorge Eduardo Pérez Pérez</p>]]></content><author><name>Jorge Pérez Pérez</name><email>jorgepp@banxico.org.mx</email></author><category term="ley del economista" /><category term="local labor markets" /><category term="employment" /><category term="research" /><summary type="html"><![CDATA[Texto de carta al Honorable Representate Arcos Benavides sobre Ley del Economista]]></summary></entry><entry><title type="html">The Efficacy of Hiring Credits in Distressed Areas</title><link href="https://jorpppp.github.io/posts/2021/1/nc/" rel="alternate" type="text/html" title="The Efficacy of Hiring Credits in Distressed Areas" /><published>2021-01-05T00:00:00-05:00</published><updated>2021-01-05T00:00:00-05:00</updated><id>https://jorpppp.github.io/posts/2021/1/nc</id><content type="html" xml:base="https://jorpppp.github.io/posts/2021/1/nc/"><![CDATA[<p><a href="/posts/2020/11/nc_es">Versión en español</a></p>

<p>Hiring tax credits are a commonly used tool at the state level and as part of federal programs to address both short-run downturns and longer-run economic distress. Evidence has found mixed results, with null or positive employment effects depending on the characteristics of the program introduced. The empirical evaluation of these policies is difficult as their enactment is typically endogenous to expected economic prospects or local economic distress.</p>

<p>In a <a href="/files/Perez_Suher_NC_Hiring_Credits.pdf">research paper</a> with <a href="https://www.federalreserve.gov/econres/michael-suher.htm">Michael Suher</a>, we examine a series of tax credit programs enacted in North Carolina, whose structure enables causal estimates of policy impacts. The programs assign credit size based on an economic distress rank. They include thresholds at which credit size jumps discontinuously, allowing for regression discontinuity (RD) estimates.</p>

<h2 id="north-carolinas-hiring-tax-credit-programs">North Carolina’s Hiring Tax Credit Programs</h2>

<p>We focus on the William S. Lee program, which began in 1996 to 2006 in North Carolina. This program gave fiscal incentives to help the economy of the more distressed counties. The 100 counties were ranked according to a formula that estimated their level of distress. The Lee program specified county rankings based on unemployment rates, income per capita, and population growth. Each county received a score for each of these three rankings. Afterward, the score was summed and ordered to create the 1 to 100 distress rank for the coming year. With this rank, counties were assigned to three different tiers. Credits of 12,500 were available to the ten most distressed counties designated as tier 1. This sum was paid out over four years if the beneficiary maintained the size of its payroll. The next 40 counties were assigned to tier 2 and could benefit from credits between 3,000 and 4,000 per new hire. In comparison, the last 50 counties in the least distressed tier 3 could receive between 500 and 1,000. Only firms in specific sectors, such as manufactures, were eligible. The county rank changed each year, so deductions vary over time.</p>

<h2 id="empirical-strategy">Empirical Strategy</h2>

<p>The estimation of the policy’s impact takes advantage of the fact that the relationship between the economic distress classification and the counties’ economic performance before the start of the program is weak. The amounts of the deductions vary discontinuously when crossing thresholds in the classification. Figure 1 shows the relationship between the tier assignment in 1996 and the change in the unemployment rate from 1993 to 1996. First, there is no discontinuity in the past evolution of county unemployment across the allocation thresholds. Thus, when comparing counties on both sides of the thresholds, similar counties are observed that differ in the amount of tax deduction. Second, the correlation between unemployment evolution before 1996 and the classification of economic difficulty is weak, which allows estimates to be made even using counties far from the thresholds.</p>

<table class="image">
<caption align="bottom"></caption>
<tr><td><img src="/images/blog/2021/1/f1_eng.png" alt="" /></td></tr>
</table>

<p>To estimate the program’s effect, we compare the evolution of employment and unemployment between counties of levels 1 and 2. Exploiting the discontinuity in the allocation of deductions and considering that the counties can change levels each year, we estimate dynamic discontinuous regression models that control for each county’s deduction history. The data used comes from the Bureau of Labor Statistics, the Census Bureau, and the North Carolina Department of Commerce.</p>

<h2 id="results">Results</h2>

<table class="image">
<caption align="bottom"></caption>
<tr><td><img src="/images/blog/2021/1/f2_a_eng.png" alt="" /></td></tr>
</table>
<table class="image">
<caption align="bottom"></caption>
<tr><td><img src="/images/blog/2021/1/f2_b_eng.png" alt="" /></td></tr>
</table>

<p>Figure 2 shows changes in the unemployment rate and employment/population ratio for counties three years after assignment to a tier. Each point is a combination of county and year of assignment. Since the tier assignation is repeated annually, each county is observed each year. The observations are ordered by classification of economic difficulty. Those to the left of the vertical segmented line correspond to tier 1 and the highest deduction. We observe that the relationship between the classification and the changes in unemployment/employment is approximately linear. It has a discontinuity when crossing the threshold. We estimate that three years after being classified at tier 1, counties have a 0.5 pp lower unemployment rate than they would have had without the program. They also have a one pp higher employment/population ratio. The estimates are similar if we only consider the counties closest to the threshold.</p>

<p>When carrying out difference-in-difference estimates, as is traditional in this literature, we do not find significant employment effects. We attribute these null effects to a bias caused by endogeneity in program allocation: employment in tier 2 counties tends to grow faster even without the program. The RD estimates control for this bias, and they offer a different view of program effects.</p>

<p>We estimate that each new job costs about 7,400 dollars in tax deductions. This cost compares favorably with that of other employment generation policies. Thus, the results suggest that hiring tax deductions are effective in increasing employment in economically depressed areas.</p>]]></content><author><name>Jorge Pérez Pérez</name><email>jorgepp@banxico.org.mx</email></author><category term="hiring credits" /><category term="local labor markets" /><category term="employment" /><category term="research" /><summary type="html"><![CDATA[We analyze the efficacy of hiring tax credits, particularly in distressed labor markets. These types of programs have provenhard to assess as their introduction tends to be endogenous. We find sizable and robust impacts on employment and unemployment: a $9,000 credit leads to a nearly 0.5 percentage points reduction in the unemployment rate and a 3% increase in employment in the counties where the credit was made available.]]></summary></entry><entry><title type="html">La eficacia de las deducciones fiscales por contratación de trabajadores en áreas deprimidas</title><link href="https://jorpppp.github.io/posts/2020/11/nc_es/" rel="alternate" type="text/html" title="La eficacia de las deducciones fiscales por contratación de trabajadores en áreas deprimidas" /><published>2020-11-23T00:00:00-05:00</published><updated>2020-11-23T00:00:00-05:00</updated><id>https://jorpppp.github.io/posts/2020/11/nc_es</id><content type="html" xml:base="https://jorpppp.github.io/posts/2020/11/nc_es/"><![CDATA[<p><a href="/posts/2021/1/nc">English version</a></p>

<p>Las deducciones fiscales por contratación de trabajadores son una política común para enfrentar dificultades económicas tanto temporales como persistentes. La evidencia en torno a su eficacia ha sido mixta, con efectos en el empleo que varían dependiendo de las características de las deducciones. Su evaluación empírica es difícil pues su introducción suele ser endógena a las condiciones económicas locales.</p>

<p>En <a href="/files/Perez_Suher_NC_Hiring_Credits.pdf">investigación</a> con <a href="https://www.federalreserve.gov/econres/michael-suher.htm">Michael Suher</a> evaluamos un programa de deducciones fiscales en el estado de Carolina del Norte, Estados Unidos, con una estructura cuasi-experimental. El programa asigna el monto de la deducción fiscal de acuerdo con una clasificación de dificultad económica. El programa fija umbrales de la clasificación en los cuales el monto de la deducción cambia de manera abrupta, permitiendo estimar modelos de regresión discontinua.</p>

<h2 id="el-programa-de-deducciones-fiscales-por-contratación-de-trabajadores-de-carolina-del-norte">El programa de deducciones fiscales por contratación de trabajadores de Carolina del Norte</h2>

<p>Nos enfocamos en en el Programa William S. Lee que operó de 1996 a 2006 en Carolina del Norte. Este programa otorgó incentivos fiscales para mejorar la situación de los condados con una economía menos robusta. Los 100 condados de Carolina del Norte fueron clasificados de acuerdo a una fórmula que calculaba su grado de dificultad económica. Los condados se ordenan de mayor a menor de acuerdo con su desempleo, y de menor a mayor de acuerdo a su ingreso per cápita y su crecimiento poblacional. Cada condado recibe un puntaje para cada variable de acuerdo a su posición en el ordenamiento. Los tres puntajes se suman, y la suma se ordena para obtener una clasificación de dificultad económica. Con base en esta, los condados se asignan a tres niveles. Los 10 condados con menor valor en la clasificación se asignan al nivel 1, y reciben una deducción fiscal de 12,500 dólares por contratación. Esta suma es descontada por partes durante 4 años si la firma beneficiaria mantiene el tamaño de su nómina. Los siguientes 40 condados se asignan al nivel 2, y reciben de 3,000 a 4,000 dólares por contratación. Los últimos 50 van al nivel 3 y reciben de 500 a 1,000 dólares. Solamente las firmas en ciertas industrias, como la manufacturera, son elegibles. Los condados son reclasificados cada año, de manera que sus deducciones varían en el tiempo.</p>

<h2 id="estrategia-empírica">Estrategia empírica</h2>

<p>Nuestra estimación del impacto del programa aprovecha que la relación entre la clasificación de dificultad económica y el desempeño económico de los condados antes del inicio del programa es débil, y que los montos de las deducciones varían de manera discontinua al cruzar umbrales en la clasificación. En la Figura 1 se dibuja la relación entre la clasificación en 1996 y el cambio en la tasa de desempleo de 1993 a 1996. En primer lugar, no hay una discontinuidad en la evolución previa del desempleo de los condados al cruzar los umbrales de asignación. Así, al comparar condados en ambos lados de los umbrales, se observan condados similares que difieren en el monto de deducción fiscal. En segundo lugar, la correlación entre la evolución del desempleo antes de 1996 y la clasificación de dificultad es débil, lo que permite hacer estimaciones incluso usando condados lejos de los umbrales.</p>

<table class="image">
<caption align="bottom"></caption>
<tr><td><img src="/images/blog/2020/11/f1.png" alt="" /></td></tr>
</table>

<p>Para estimar el efecto del programa, comparamos la evolución del empleo y el desempleo entre condados de los niveles 1 y 2. Explotando la discontinuidad en la asignación de las deducciones, y teniendo en cuenta que los condados pueden cambiar de nivel cada año, se estiman modelos de regresión discontinua dinámicos que controlan por el historial de deducciones de cada condado. Los datos usados provienen del Buró de Estadísticas Laborales, el Buró del Censo y el departamento de Comercio de Carolina del Norte.</p>

<h2 id="resultados">Resultados</h2>

<table class="image">
<caption align="bottom"></caption>
<tr><td><img src="/images/blog/2020/11/f2_a.png" alt="" /></td></tr>
</table>
<table class="image">
<caption align="bottom"></caption>
<tr><td><img src="/images/blog/2020/11/f2_b_recortado.png" alt="" /></td></tr>
</table>

<p>La Figura 2 muestra cambios en la tasa de desempleo y en la razón empleo-población de los condados tres años después de la asignación a un nivel del programa. Cada punto es una combinación de condado y año de asignación. Como esta asignación de niveles se repite anualmente, cada condado se observa cada año. Las observaciones se ordenan por clasificación de dificultad económica, de manera que aquellas a la izquierda de la línea vertical segmentada corresponden al nivel 1 y a la mayor deducción. Observamos que la relación entre la clasificación y los cambios del desempleo/empleo es aproximadamente lineal, y que tiene una discontinuidad al cruzar el umbral. Estimamos que tres años después de ser clasificados en el nivel 1, los condados tienen una tasa de desempleo 0.5 p.p. más baja, y una razón empleo-población 1 p.p. más alta, respecto a las que tendrían en ausencia del programa. Las estimaciones son similares si se usan solamente los condados más cercanos al umbral.</p>

<p>Al llevar a cabo estimaciones de diferencias-en-diferencias, como es tradicional en esta literatura, no encontramos efectos significativos en el empleo. Dichos efectos nulos pueden atribuirse a un sesgo causado por endogeneidad en la asignación del programa: el empleo en los condados del nivel 2 tiende a crecer más rápido incluso en ausencia del programa. Al controlar por este sesgo, las estimaciones de regresión discontinua ofrecen una visión diferente de los efectos del programa.</p>

<p>Estimamos que cada nuevo trabajo costó alrededor de 7,400 dólares en deducciones fiscales. Este costo se compara favorablemente con el de otras políticas de generación de empleo. Así, los resultados sugieren que las deducciones fiscales a la contratación son efectivas para aumentar el empleo en áreas económicamente deprimidas.</p>]]></content><author><name>Jorge Pérez Pérez</name><email>jorgepp@banxico.org.mx</email></author><category term="hiring credits" /><category term="local labor markets" /><category term="employment" /><category term="research" /><summary type="html"><![CDATA[Analizamos la eficacia de las deducciones fiscales por contratación de trabajadores, particularmente en mercados laborales deprimidos. Este tipo de programas ha sido difícil de evaluar por su asignación endógena. Encontramos impactos robustos en el desempleo y en el empleo: una deducción de 9000 dólares por contratación reduce la tasa de desempleo en 0.5 pp e incrementa el empleo en 3% en los condados donde la deducción estuvo disponible.]]></summary></entry><entry><title type="html">¿Ajustes al salario mínimo? Una conversación incómoda pero necesaria</title><link href="https://jorpppp.github.io/posts/2020/08/ofiscal/" rel="alternate" type="text/html" title="¿Ajustes al salario mínimo? Una conversación incómoda pero necesaria" /><published>2020-08-18T00:00:00-04:00</published><updated>2020-08-18T00:00:00-04:00</updated><id>https://jorpppp.github.io/posts/2020/08/ofiscal</id><content type="html" xml:base="https://jorpppp.github.io/posts/2020/08/ofiscal/"><![CDATA[<p>Publiqué una entrada en el blog del Observatorio Fiscal de la Universidad Javierana acerca de los impactos del salario mínimo, y cómo fijarlo para el 2021 en un escenario de pandemia.</p>

<p><a href="https://www.ofiscal.org/single-post/2020/08/17/%C2%BFAjustes-al-salario-m%C3%ADnimo-Una-conversaci%C3%B3n-inc%C3%B3moda-pero-necesaria">¿Ajustes al salario mínimo? Una conversación incómoda pero necesaria</a></p>]]></content><author><name>Jorge Pérez Pérez</name><email>jorgepp@banxico.org.mx</email></author><category term="mercado laboral" /><category term="salario mínimo" /><category term="informalidad" /><category term="Colombia" /><summary type="html"><![CDATA[Entrada en el blog del Observatorio Fiscal de la Universidad Javeriana]]></summary></entry><entry><title type="html">Webinar: Mercado Laboral y Recuperación Económica</title><link href="https://jorpppp.github.io/posts/2020/06/webinar_mlre/" rel="alternate" type="text/html" title="Webinar: Mercado Laboral y Recuperación Económica" /><published>2020-06-23T00:00:00-04:00</published><updated>2020-06-23T00:00:00-04:00</updated><id>https://jorpppp.github.io/posts/2020/06/webinar_mlre</id><content type="html" xml:base="https://jorpppp.github.io/posts/2020/06/webinar_mlre/"><![CDATA[<p>El 17 de Junio participé en el Webinar: Mercado Laboral y Recuperación Económica, de la Universidad de Los Andes y la Universidad Eafit. Junto con Giulia Lotti (BID) y Cristina Fernández (Fedesarrollo), discutimos mucho sobre el salario mínimo como herramienta de política para reactivar el mercado laboral durante y después de la cisis causada por Covid-19.</p>

<p>Aquí están el <a href="https://www.youtube.com/watch?v=qH0-sj6Vklg&amp;feature=youtu.be">video del webinar</a> y <a href="/files/Webinar.pdf">la presentación que usé</a>.</p>

<p>En la presentación hago referencia a varios artículos en los que he trabajado: Acerca del <a href="https://doi.org/10.1016/j.worlddev.2020.104999">salario mínimo en Colombia</a>,de las <a href="https://www.banxico.org.mx/publicaciones-y-prensa/documentos-de-investigacion-del-banco-de-mexico/%7BCF0A9949-2D72-6738-EF15-57CFA57249CD%7D.pdf">deducciones fiscales por contratación</a> y de los <a href="https://jorgeperezperez.com/research/2017-10-10-city-minimum-wages">salarios mínimos locales</a>.</p>

<p>Además hago referencia a varios artículos y entradas de prensa, listados a continuación:</p>

<p><a href="http://www.google.com/url?q=http%3A%2F%2Feconweb.umd.edu%2F~saltiel%2Ffiles%2Fwfh_mostrecent.pdf&amp;sa=D&amp;sntz=1&amp;usg=AFQjCNF7-U4Gimc3Gml0MV784oei7yVLFQ">Saltiel, F. (2020). “Who Can Work From Home in Developing Countries?”. Documento de trabajo</a></p>

<p><a href="https://openknowledge.worldbank.org/bitstream/handle/10986/28682/9781464810398.pdf">Messina, J., &amp; Silva, J. (2017). Wage inequality in Latin America: Understanding the past to prepare for the future. The World Bank.</a></p>

<p><a href="https://ladelgadop.blogspot.com/2020/06/breve-evidencia-teorica-y-empirica.html">Delgado, L (2020). “Breve evidencia teórica y empírica sobre regulaciones al Mercado Laboral.” Consultado Jun 23, 2020</a></p>

<p><a href="https://www.journals.uchicago.edu/doi/abs/10.1086/685449">Dube, A., Lester, T. W., &amp; Reich, M. (2016). Minimum wage shocks, employment flows, and labor market frictions. <em>Journal of Labor Economics</em>, 34(3), 663-704.</a></p>

<p><a href="https://www.sciencedirect.com/science/article/pii/S0047272719300052">Clemens, J., &amp; Wither, M. (2019). The minimum wage and the Great Recession: Evidence of effects on the employment and income trajectories of low-skilled workers. <em>Journal of Public Economics</em>, 170, 53-67.</a></p>

<p><a href="https://academic.oup.com/qje/article-abstract/134/3/1405/5484905">Cengiz, D., Dube, A., Lindner, A., &amp; Zipperer, B. (2019). The effect of minimum wages on low-wage jobs. <em>The Quarterly Journal of Economics</em>, 134(3), 1405-1454.</a></p>

<p><a href="https://www.journals.uchicago.edu/doi/abs/10.1086/702650">Monras, J. (2019). Minimum wages and spatial equilibrium: Theory and evidence. <em>Journal of Labor Economics</em>, 37(3), 853-904.</a></p>

<p><a href="https://papers.ssrn.com/sol3/papers.cfm?abstract_id=3309362">Zhang, W. (2018). Distributional Effects of Local Minimum Wage Hikes: A Spatial Job Search Approach. Available at SSRN 3309362.</a></p>

<p><a href="https://www.aeaweb.org/doi/10.1257/aer.20141374">Beaudry, P., Green, D. A., &amp; Sand, B. M. (2018). In search of labor demand. <em>American Economic Review</em>, 108(9), 2714-57</a></p>

<p><a href="http://repositorio.banrep.gov.co/handle/20.500.12134/6336">Arango, L. E., &amp; Flórez, L. A. (2017). Informalidad laboral y elementos para un salario mínimo diferencial por regiones en Colombia. Borradores de Economía, 1023.</a></p>

<p><a href="https://ideas.repec.org/p/col/000089/005540.html">Sánchez, F., Duque, V., &amp; Ruiz, M. (2009). Costos laborales y no laborales y su impacto sobre el desempleo, la duración del desempleo y la informalidad en Colombia, 1980-2007 (No. 005540). Universidad de los Andes-CEDE.</a></p>

<p><a href="https://www.sciencedirect.com/science/article/pii/S0927537106000054">Gindling, T. H., &amp; Terrell, K. (2007). The effects of multiple minimum wages throughout the labor market: The case of Costa Rica. Labour Economics, 14(3), 485-511.</a></p>

<p><a href="https://www.google.com/url?sa=t&amp;rct=j&amp;q=&amp;esrc=s&amp;source=web&amp;cd=&amp;cad=rja&amp;uact=8&amp;ved=2ahUKEwj5nt_wv5nqAhURCKwKHd89DjIQFjAAegQIARAB&amp;url=http%3A%2F%2Fjobsanddevelopmentconference.org%2Fwp-content%2Fuploads%2F2016%2F10%2FLOTTI_Minimum-Wages-and-Informal-Employment-in-Developing-Countries.pdf&amp;usg=AOvVaw2bUz_1ZwOhBY85d3dRZ9J-">Lotti, G., Messina, J., &amp; Nunziata, L. (2016). Minimum Wages and Informal Employment in Developing Countries. World Bank.</a></p>

<p><a href="https://academic.oup.com/restud/article-abstract/86/2/593/4829925">Cahuc, P., Carcillo, S., &amp; Le Barbanchon, T. (2019). The effectiveness of hiring credits. <em>The Review of Economic Studies</em>, 86(2), 593-626.</a></p>]]></content><author><name>Jorge Pérez Pérez</name><email>jorgepp@banxico.org.mx</email></author><category term="mercado laboral" /><category term="salario mínimo" /><category term="informalidad" /><category term="covid-19" /><summary type="html"><![CDATA[Intervención en el Webinar: Mercado Laboral y Recuperación Económica - Universidad de Los Andes y Universidad Eafit - Junio 17 2020]]></summary></entry><entry><title type="html">The Effects of a Real Minimum Wage Increase in the Formal and Informal Sectors</title><link href="https://jorpppp.github.io/posts/2019/08/mwcol/" rel="alternate" type="text/html" title="The Effects of a Real Minimum Wage Increase in the Formal and Informal Sectors" /><published>2019-08-26T00:00:00-04:00</published><updated>2019-08-26T00:00:00-04:00</updated><id>https://jorpppp.github.io/posts/2019/08/mwcol</id><content type="html" xml:base="https://jorpppp.github.io/posts/2019/08/mwcol/"><![CDATA[<p><a href="/posts/2019/08/mwcol_es">Versión en español</a></p>

<p>The minimum wage is a typical policy in developed and developing countries. Most of the literature about the impact of the minimum wage focuses on the effects on a labor market with regulatory compliance. We know less about the effects of the minimum wage on informal
labor markets. In them, labor regulations are unlikely to be binding and compliance is low.</p>

<p>The minimum wage may have a direct impact on the informal market by influencing informal labor contracts. It may also have an indirect impact due to linkages with the formal sector. Formal and informal labor markets may be connected, such that wages in the formal sector may have an impact on wages in the informal one. For example, formal workers may buy goods and services provided by informal workers.</p>

<p>In my <a href="/files/Jorge_Perez_Minimum_wage_informal_Colombia.pdf">research</a> I estimate the effecto on an increase in the minimum wage on informal and formal wage distributions in Colombia. I take advantage of an increase in the national minimum wage in 16 percent at the end of 1998, which corresponded to expected inflation for the next year. However, in 1999 observed inflation was notoriously below expected inflation due to a financial crisis in this country. This resultes in a large and unexpected increase in the real minimum wage. For the first quarter of 1999, the real minimum wage increased about 11 percent.</p>

<table class="image">
<caption align="bottom"></caption>
<tr><td><img src="/images/blog/2019/8/densidades_en.png" alt="" /></td></tr>
</table>

<p>Figure 1 the density of real wages in the formal and informal sector, and the level of the real minimum wage before and after the shock. The modes of both distributions shift together with the real minimum wage. This suggests there was an impact of the increase in the minimum wage in both sectors. However, densities before and after the increase are similar for high real minimum wages, far from the minimum wage in the wage distribution. This suggests that the real minimum wage increase only affected wages close to it.</p>

<h2 id="empirical-strategy">Empirical Strategy</h2>

<p>Figure 1 is not unambiguous evidence of an impact of the minimum wage increase on wages. There may be other changes in labor markets over time that induce shifts in wage distributions. To isolate the effect of the minimum wage on this country-level distributions, I adopt an estimation strategy that compares the time changes of wage densities across city-industry blocks with different minimum wage incidence. I define this incidence as the percentage of workers whose real wage is between the old and the new minimum wage, before the minimum wage increase. This comparison combines a quantile regression method with a differences-in-differences specification. To tranlsate the effects in city-industry level wage distributions to effects in the country-level wage density, I use an unconditional quantile regression method. This technique weights the impact on each city-industry block by its contribution to the national wage distribution.</p>

<p>An important challenge to identify minimum wage effects in this context is the simultaneous onset of the financial crisis and the real minimum wage increase. I tackle this by controlling by city-specific trends and local labor market shocks. These may have induced differences in the time evolution of wages across cities and industries.</p>

<p>Wage and employmente data provide from the National Household Survey in Colombia. The data cover the period from the second quarter of 1996 to the second quarter of 2000.</p>

<h2 id="effects-on-wages">Effects on Wages</h2>

<p>I find that for a larger incidence of the minimum wage, there is a larger increase in wages as a consecuence of the increase in the minimukm wage. This occurs on both the formal and informal sectors, in the percentiles of the wage distribution where the minimum wage binds. The effects do not spillover to the rest of the distribution. Figure 2 shows the results. In the formal sector, there is eveidence of wage increases below and close to the new real minimum wage, up to the 30th percentile of the wage distribution. In the informal sector, there is evidecne of increases above the median, also close to the new real minimum wage. The effects on formal wages are larger than those on informal wages.</p>

<table class="image">
<caption align="bottom"></caption>
<tr><td><img src="/images/blog/2019/8/efectos_en.png" alt="" /></td></tr>
</table>

<h2 id="magnitudes-and-mechanisms">Magnitudes and Mechanisms</h2>

<p>To better assess the size of these wage effects of the minimum wage increase, I compare the estimated effects to a hypothetical scenario. In this sceneario, only the workers for whom the minimum wage increase is binding receive a wage increase to set their wage to the new minimum. Around the minimum wage, the estimated effects are smaller than the hypothetical. This suggests partial compliance with the minimum wage policy. For wages below the old minimum wage, the estimated effects are larger than the hypothetical. This suggests the minimum wageis used as a reference to set wages in the lower tail of the distribution. The effects in the informal sector suggest that the minimum wage is also used as reference in that sector.</p>

<p>The effects in the informal sector may not be due to a reference role of the minimum wage, but to indirect effects coming from the formal sector. They may come through the linkages between formal and informal labor markets of goods and services. To evaluate these indirect effects, I estimate the effect of formal minimum wage incidence on informal market wages. I find that the effects in the informal sector are not explained by an indirect effect.</p>

<p>These results are informative abou the effects of the minimum wage in a country with a large informal sector. The tehcnique I implemented here can be used to evaluate minimum wage increases in other countries. However, caution is needed to extrapolate these results to other developing countries, as they may be invalid for other contexts or differently-sized increases.</p>]]></content><author><name>Jorge Pérez Pérez</name><email>jorgepp@banxico.org.mx</email></author><category term="minimum wage" /><category term="wage distribution" /><category term="informal labor markets" /><category term="research" /><summary type="html"><![CDATA[I estimate the effect of a real minimum wage increase on formal and informal wages, and on employment in Colombia. I find evidence of positive wage responses for wages close to the minimum wage. The results show that wages increase more in the formal than in the informal sector. I do not find that informal wages react to the minimum wage indirectly, through the linkages between the formal and the informal market.]]></summary></entry><entry><title type="html">Los efectos de un incremento en el salario mínimo real en los sectores formal e informal</title><link href="https://jorpppp.github.io/posts/2019/08/mwcol_es/" rel="alternate" type="text/html" title="Los efectos de un incremento en el salario mínimo real en los sectores formal e informal" /><published>2019-08-26T00:00:00-04:00</published><updated>2019-08-26T00:00:00-04:00</updated><id>https://jorpppp.github.io/posts/2019/08/mwcol_es</id><content type="html" xml:base="https://jorpppp.github.io/posts/2019/08/mwcol_es/"><![CDATA[<p><a href="/posts/2019/08/mwcol">English version</a></p>

<p>El salario mínimo es una política común en países desarrollados y en vías de desarrollo. La mayoría de la literatura sobre el impacto del salario mínimo se centra en los efectos en un mercado laboral donde se cumplen las leyes. Sabemos poco sobre los efectos del salario
mínimo en los mercados informales de trabajo, donde el cumplimiento con la regulación laboral es menor que en el sector formal.</p>

<p>El salario mínimo podría tener un impacto directo en el mercado informal al influir en los contratos laborales informales. También podría tener un impacto indirecto debido a vínculos con el sector formal. Los mercados laborales formales e informales pueden estar interconectados, de manera que los salarios del mercado formal pueden incidir en los salarios informales. Por ejemplo, los trabajadores formales pueden comprar bienes y servicios proveídos por los trabajadores informales.</p>

<p>En mi <a href="http://www.banxico.org.mx/publicaciones-y-prensa/documentos-de-investigacion-del-banco-de-mexico/%7B344E41EF-5105-C5FF-74D6-8FA5D7D089AC%7D.pdf">investigación</a> estimo el efecto de un incremento en el salario mínimo en las distribuciones salariales de los mercados laborales formal e informal en Colombia. Aprovecho que las autoridades colombianas incrementaron el salario mínimo nacional en 16 por ciento a finales de 1998, un aumento equivalente a la inflación esperada para el año siguiente. Sin embargo, en 1999 la inflación observada se ubicó notoriamente por debajo de la inflación prevista debido a una crisis financiera en ese país. Lo anterior tuvo como consecuencia un aumento grande e inesperado en el salario mínimo real. Para el primer trimestre de 1999, el salario mínimo real se incrementó alrededor de 11 por ciento.</p>

<table class="image">
<caption align="bottom"></caption>
<tr><td><img src="/images/blog/2019/8/densidades.png" alt="" /></td></tr>
</table>

<p>La Figura 1 muestra las densidades de los salarios reales en los sectores formal e informal, y los niveles del salario mínimo antes y después del choque. Las modas de ambas distribuciones aumentan en consonancia con el salario mínimo real. Esto sugiere que el incremento del salario mínimo tuvo un impacto en ambos sectores. Sin embargo, las densidades antes y después del incremento son similares para niveles de salario real altos, lejanos al salario mínimo. Esto sugiere que el incremento del salario mínimo real solo afectó a los salarios cercanos a este.</p>

<h2 id="estrategia-empírica">Estrategia empírica</h2>

<p>La Figura 1 no es evidencia inequívoca de un impacto del incremento del salario mínimo en los salarios. Podría haber otros cambios en los mercados laborales en el tiempo que induzcan cambios en las densidades salariales. Para aislar el efecto del salario mínimo en estas densidades salariales a nivel nacional, adopto una estrategia de estimación que compara los cambios en el tiempo en las densidades salariales entre bloques ciudad-industria con diferente vinculación al incremento del salario mínimo. Defino la vinculación como el porcentaje de trabajadores cuyo salario real está entre el antiguo y el nuevo salario mínimo real antes del incremento. La comparación combina un método de regresión por percentiles con una especificación de diferencias en diferencias. Para trasladar los efectos del incremento en el salario mínimo en las densidades salariales en cada bloque ciudad-industria, a los efectos en las densidades salariales agregadas a nivel nacional, uso un método de regresión por percentiles no condicionales. Este método pondera el efecto en cada bloque ciudad-industria por su contribución a la densidad salarial nacional.</p>

<p>Un desafío importante para identificar los efectos del salario mínimo en este contexto es la ocurrencia simultánea de la crisis financiera y el incremento inesperado en el salario mínimo real. Atiendo esta preocupación controlando por tendencias específicas a cada ciudad y por choques locales a la demanda de trabajo, que podrían inducir diferencias en la evolución de los salarios a través de las ciudades e industrias.</p>

<p>Los datos de salarios y empleo en los sectores formal e informal, por ciudad e industria, provienen de la Encuesta Nacional de Hogares de Colombia. Los datos abarcan el período del segundo trimestre de 1996 al segundo trimestre de 2000.</p>

<h2 id="efectos-en-los-salarios">Efectos en los salarios</h2>

<p>Encuentro que ante una mayor vinculación al incremento del salario mínimo, hay un mayor aumento en los salarios como consecuencia del incremento en el mínimo. Esto ocurre tanto en el sector formal como el informal, alrededor de los percentiles donde el salario mínimo incide. Los efectos no se propagan al resto de la distribución. La Figura 2 muestra los resultados. En el sector formal, hay evidencia de incrementos para los salarios por debajo y cerca del nuevo salario mínimo real, hasta el percentil 30 de la distribución salarial. En el sector informal, hay evidencia de incrementos por encima de la mediana, también cerca del nuevo salario mínimo real. Los efectos en los salarios del sector formal son más grandes que en los salarios del sector informal.</p>

<table class="image">
<caption align="bottom"></caption>
<tr><td><img src="/images/blog/2019/8/efectos.png" alt="" /></td></tr>
</table>

<h2 id="magnitud-de-los-efectos-y-mecanismos">Magnitud de los efectos y mecanismos</h2>

<p>Para dimensionar los efectos en salarios como respuesta al incremento del salario mínimo, comparo los efectos estimados con un escenario hipotético, donde únicamente los trabajadores para los cuales el incremento en el salario mínimo es vinculante reciben un incremento salarial para llevar su salario al nuevo salario mínimo. Alrededor del salario mínimo, los efectos estimados son menores que los hipotéticos. Esto sugiere un cumplimiento parcial con la política de salario mínimo. Para salarios por debajo del salario mínimo anterior, los efectos estimados son mayores que los hipotéticos. Esto sugiere que el salario mínimo es usado como referencia para la fijación de salarios en la cola inferior de la distribución de salarios formales. Además, los efectos en el sector informal sugieren que el salario mínimo también es usado como referencia en este sector.</p>

<p>Los efectos en el sector informal podrían no deberse a un rol de referencia del salario mínimo, sino a efectos indirectos que vienen del sector formal, a través de los vínculos entre los mercados de bienes y servicios formales e informales. Para evaluar estos efectos indirectos, estimo el efecto de la vinculación al salario mínimo en el sector formal en los salarios del sector informal. Encuentro que las respuestas de los salarios en el sector informal no son explicadas por un efecto indirecto.</p>

<p>Estos resultados son informativos del efecto del salario mínimo en un país con un sector informal grande. La técnica empleada puede usarse para evaluar incrementos en el salario mínimo en otros lugares. Sin embargo, se debe ser cuidadoso al extrapolar estos resultados a otros países en vías de desarrollo, pues pueden ser inválidos para aumentos mayores de salario mínimo, o en diferentes contextos.</p>]]></content><author><name>Jorge Pérez Pérez</name><email>jorgepp@banxico.org.mx</email></author><category term="minimum wage" /><category term="wage distribution" /><category term="informal labor markets" /><category term="research" /><summary type="html"><![CDATA[Estimo el efecto de un incremento en el salario mínimo real en los salarios formales e informales, y en el empleo en Colombia. Encuentro evidencia de respuestas positivas de los salarios cercanos al mínimo. Los resultados muestran que los salarios alrededor del mínimo aumentan más en el sector formal que en el informal. No encuentro que los salarios informales reaccionen al salario mínimo de manera indirecta, a través de vínculos entre el mercado formal y el informal.]]></summary></entry><entry><title type="html">Decomposing multidimensional poverty headcounts</title><link href="https://jorpppp.github.io/posts/2018/03/mpi/" rel="alternate" type="text/html" title="Decomposing multidimensional poverty headcounts" /><published>2018-03-21T00:00:00-04:00</published><updated>2018-03-21T00:00:00-04:00</updated><id>https://jorpppp.github.io/posts/2018/03/mpi</id><content type="html" xml:base="https://jorpppp.github.io/posts/2018/03/mpi/"><![CDATA[<p><a href="/posts/2018/03/mpi_es">Versión en Español</a></p>

<p>Multidimensional poverty measures have been gaining ground among policymakers developing countries. They are now routinely calculated along with traditional monetary poverty measures. Recently, the Colombian government <a href="https://www.elespectador.com/economia/las-16-apuestas-del-gobierno-para-el-desarrollo-sostenible-articulo-744808">announced it would use multidimensional poverty</a> to set its 2030 poverty reduction goal.</p>

<p>The encompassing nature of multidimensional poverty indices is one of its main advantages. It allows policymakers to assess improvements on a wide array of household characteristics through a small set of indicators. However, this attractive feature can become a drawback when tracking the evolution of multidimensional poverty over time. A drop in monetary poverty means that income increased for some households. A drop in multidimensional poverty, however, can be due to a wide array of changes. Was it because households managed to send their kids to school? Or because a family member managed to find a job? Answering these questions requires tracking each dimension of poverty separately, quickly defeating the purpose of a single poverty measure. It may also require panel data to track households over time, which is not available in many developing country contexts.</p>

<p>In our <a href="http://www.jorgeperezperez.com/files/Jorge_Perez_MPI.pdf">research</a> with Carlos Rodriguez-Castelán, José Daniel Trujillo, and Daniel Valderrama, we develop a methodology to decompose changes in multidimensional poverty over time into contributions by 
dimension. We validate it on panel and repeated cross-sectional data, and apply it to the recent decline in multidimensional poverty in Colombia.</p>

<h2 id="the-importance-of-the-multidimensional-poverty-headcount">The Importance of the Multidimensional Poverty Headcount</h2>

<p>Multidimensional poverty analyses usually comprise three indices: the multidimensional poverty headcount (H) —which measures the incidence of poverty— the average deprivation share among the poor (A) —which measures the severity of poverty— and the adjusted headcount ratio (M0), which combines both incidence and severity. We focus on the multidimensional poverty headcount for two reasons. First, because this indicator has received most attention by policymakers, as it is directly comparable to the monetary poverty rate.</p>

<p>The second reason is that declines in the adjusted headcount ratio across developing countries are mostly due to a decreasing incidence of poverty —which is measured by the headcount—as opposed to decreases in the intensity of poverty (Apablaza et. al. 2010, Apablaza and Yalonetzky 2013). Figure 1 shows this for the Colombian context. Between 2008 and 2012, the adjusted headcount ratio declines from 0.154 to 0.115, a 23 % decrease in poverty adjusted by its intensity. This decrease is mostly driven by decreases in the multidimensional poverty headcount. The number of people who were poor decreases sharply, but the extent of poverty for those who remain poor remains relatively constant. The number of multidimensionally poor falls from 34 % in 2008 to about 27 &amp; in 2012. From 2008 to 2010, this accounts for 77 % of the decline in the adjusted headcount ratio. From 2010 to 2012, this share increased to 90 %. The intensity of poverty remains relatively constant throughout the period.</p>

<table class="image">
<caption align="bottom">Figure 1: Trends in Monetary and Multidimensional Poverty in Colombia</caption>
<tr><td><img src="/images/blog/2018/3/fig1.png" alt="Figure 1: Trends in Monetary and Multidimensional Poverty in Colombia" /></td></tr>
</table>

<h2 id="the-contribution-of-each-dimension">The Contribution of Each Dimension</h2>

<p>To find out which dimensions contribute more to this poverty decline, we adapt a methodology based on counterfactual simulations (Barros et. al 2006; Azevedo et al 2012, 2013a, 2013b) to the multidimensional headcount. Improvements in one dimension may bring a household below the poverty threshold but may be insufficient for other households that are deprived in many dimensions. Our methodology simulates changes dimensions one by one and tracks the counterfactual overall headcount ratio to arrive at the contribution of each dimension.</p>

<p>We validate our methodology using a panel dataset of Colombian households, the ELCA, where we show to apply the method when it is possible to track individuals over time. We then turn to repeated cross-sectional data, the ECV, and decompose the decline in poverty between 2008 and 2012.</p>

<p>Table 1 shows the contribution of dimensions, by category, to the overall decrease in the multidimensional poverty headcount. More than half of the decrease can be attributed to improvements in health –such as access to health insurance and health services-, and education –such as increases in years of education and literacy. Changes in employment conditions contribute little to the overall poverty decrease.</p>

<table class="image">
<caption align="bottom">Table 1: Decomposition of the Change in the Multidimensional Poverty Headcount. Colombia. ECV 2008-2012</caption>
<tr><td><img src="/images/blog/2018/3/tab1.PNG" alt="Table 1: Decomposition of the Change in the Multidimensional Poverty Headcount. Colombia. ECV 2008-2012" /></td></tr>
</table>

<p>We also show that the decomposition provides information about poverty dynamics that is absent from standard analyses. Censored headcounts, that is, those deprived in each dimension among the poor, do not change as drastically in the health and education dimensions. Uncensored headcounts, those deprived in each dimension in the whole sample, decline substantially in the dimensions associated with standard of living, but this is not reflected in the overall multidimensional poverty headcount. Our methodology succinctly summarizes the drivers behind the decline without tracking these sets of indicators.</p>

<h3 id="references">References</h3>

<p>APABLAZA , M.; O CAMPO , J.P. and G., YALONETZKY (2010). “Decomposing Changes in Multidimensional Poverty in 10 Countries”. Mimeo, Oxford Poverty and Human Development Initiative.</p>

<p>APABLAZA , M. and YALONETZKY , G. (2013). “Decomposing Multidimensional Poverty Dynamics”. Working Paper 101, Young Lives.</p>

<p>AZEVEDO , JOAO PEDRO ; SANFELICE , VIVIANE and NGUYEN , MINH CONG (2012). “Shapley Decomposition by Components of a Welfare Aggregate”. Mimeo, the World Bank.</p>

<p>AZEVEDO , JOAO PEDRO ; INCHAUSTE , GABRIELA ; OLIVIERI , SERGIO ; SAAVEDRA , JAIME and WINKLER , HERNAN (2013a). “Is Labor Income Responsible for Poverty Reduction? A Decomposition Approach”. Policy Research Working Paper 6414, The World Bank.</p>

<p>BARROS , RICARDO ; DE CARVALHO , MIRELA ; FRANCO , SAMUEL and MENDOCA , ROSANNE (2006). “Uma Análise das Principais Causas da Queda Recente na Desigualdade de Renda Brasileira”. Revista Econômica, <strong>8(1)</strong>, pp. 117–147.</p>]]></content><author><name>Jorge Pérez Pérez</name><email>jorgepp@banxico.org.mx</email></author><category term="multidimensional poverty" /><category term="colombia" /><category term="research" /><summary type="html"><![CDATA[Multidimensional measures of poverty have become standard as complementary indicators of poverty in many countries. We propose an application of existing methodologies that decompose welfare aggregates -based on counterfactual simulations- to break up the changes of the multidimensional poverty headcount into the variation attributed to each of its dimensions.]]></summary></entry></feed>